Fig. 2
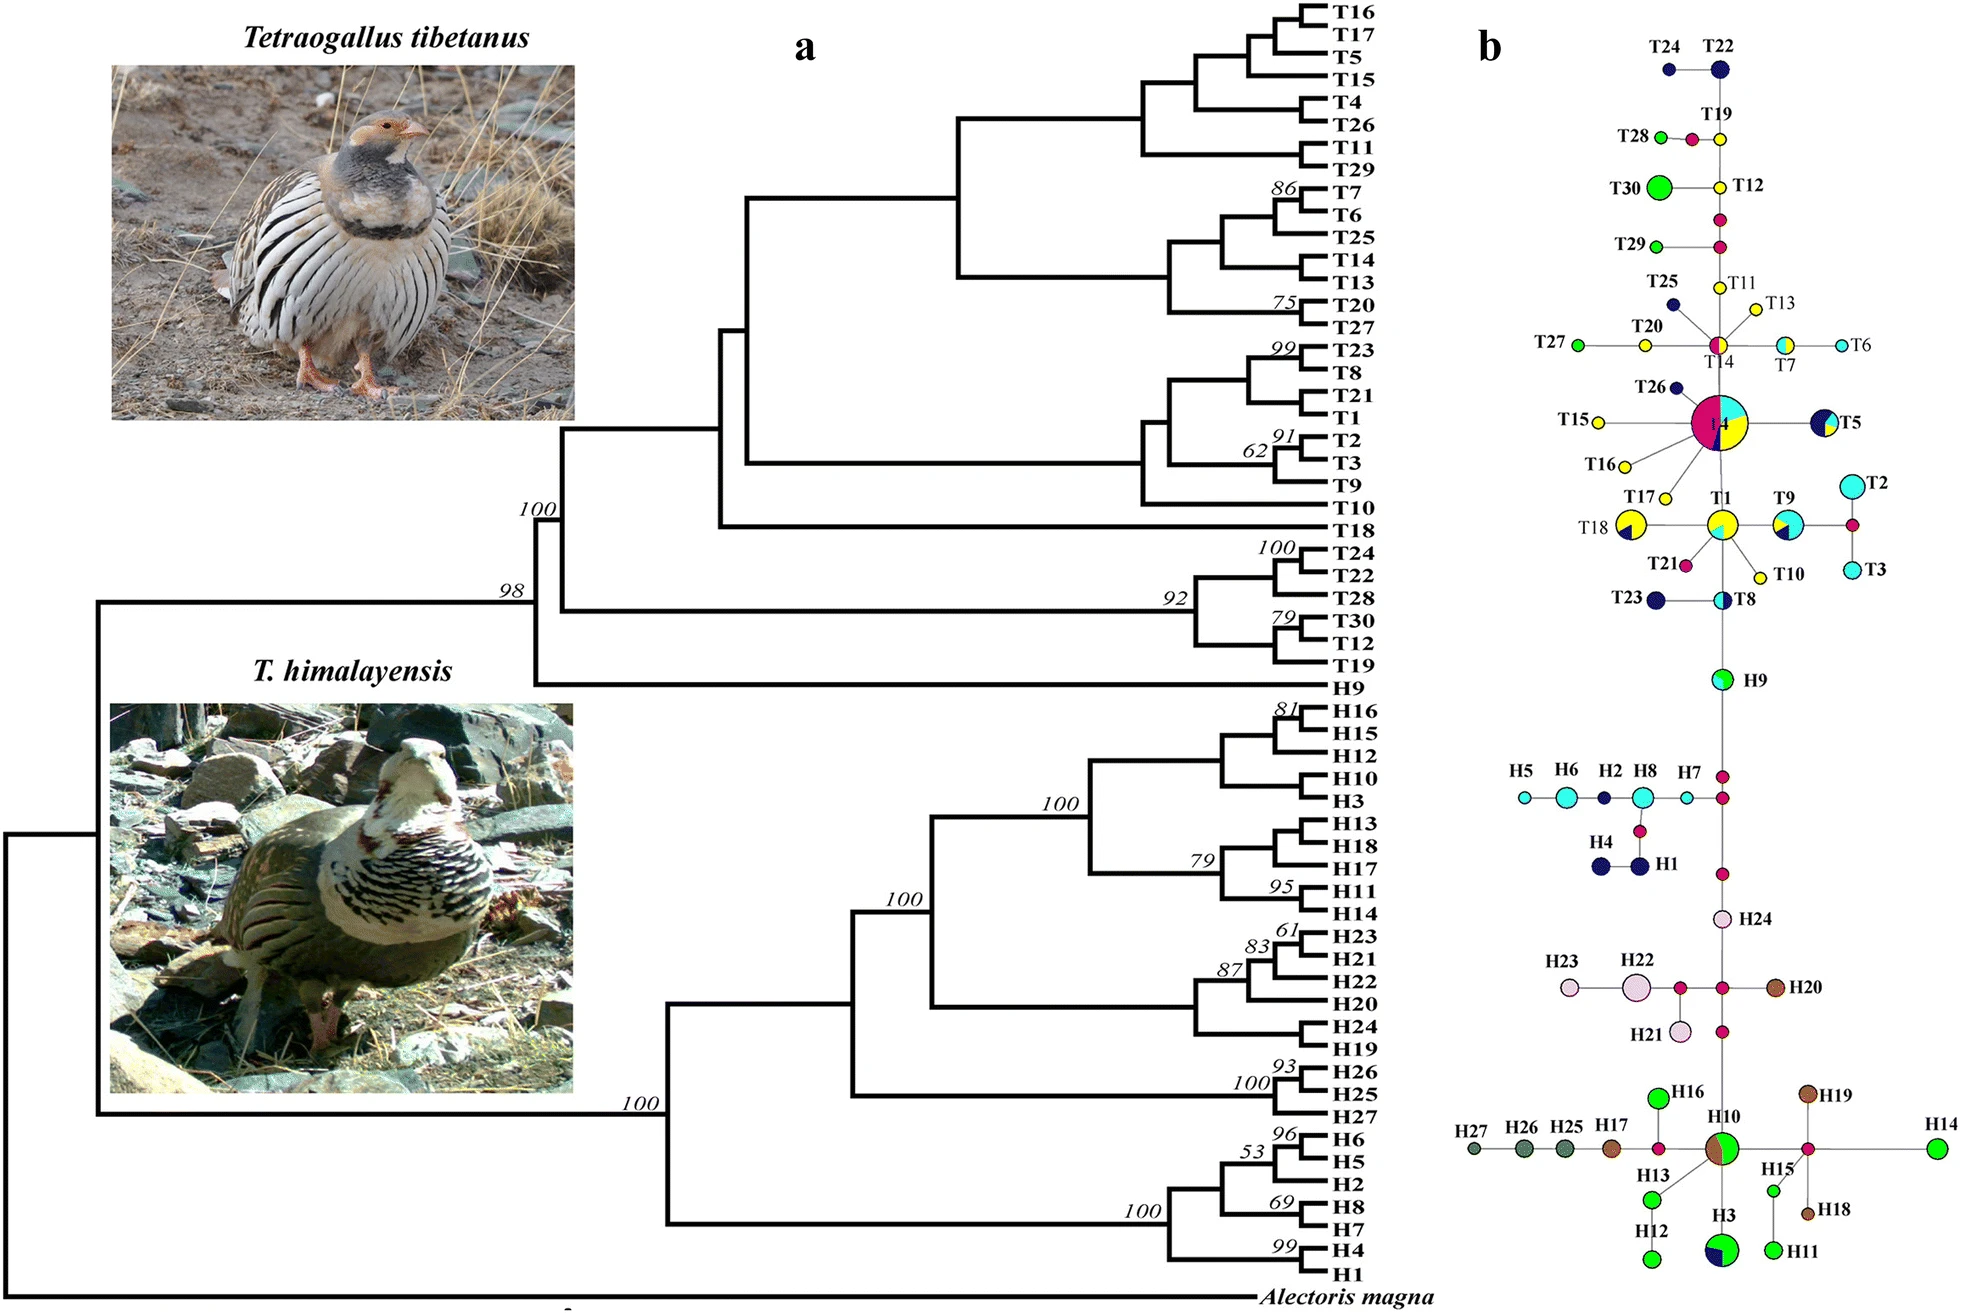
Phylogenetic relationships among mitochondrial DNA haplotypes. a Mitochondrial DNA Bayesian phylogeny for T. himalayensis and T. tibetanus. The two species structured clades are separated. Each haplotype of T. himalayensis was named Capital H before numbers and T. tibetanus was named capital T before numbers. The color and the source population of haplotypes are as follows: light blue from QLS, dark blue from TGL, dark pink from BKL, dark blue from QDM, green from KLS, brown from WTS, light pink from ETS, dark green from PME. Abbreviations see details in Fig. 1. Numbers above branches indicate BI posterior probabilities. Only bipartitions with bootstrap or posterior probability values above 50 and 0.5, respectively, are shown. b Median-joining network among mitochondrial DNA haplotypes. The haplotypes are indicated by circles, the size of each circle being proportional to the observed frequency of each haplotype. Lines drawn between haplotypes represent mutation events and small red circles represent missing alleles that were not observed